 Analytics Engine
Learning Analytics is the measurement, collection, analysis, and reporting of data about learners and their contexts, for purposes of understanding and optimizing learning and the environments in which it occurs. For L&D teams, having easy access to all of the relevant, detailed and structured information from their various learning environments, training programs and educational tools is more mission critical than ever before but they also require effective and flexible ways to organize and manage these information flows to measure operational performance and effectiveness.
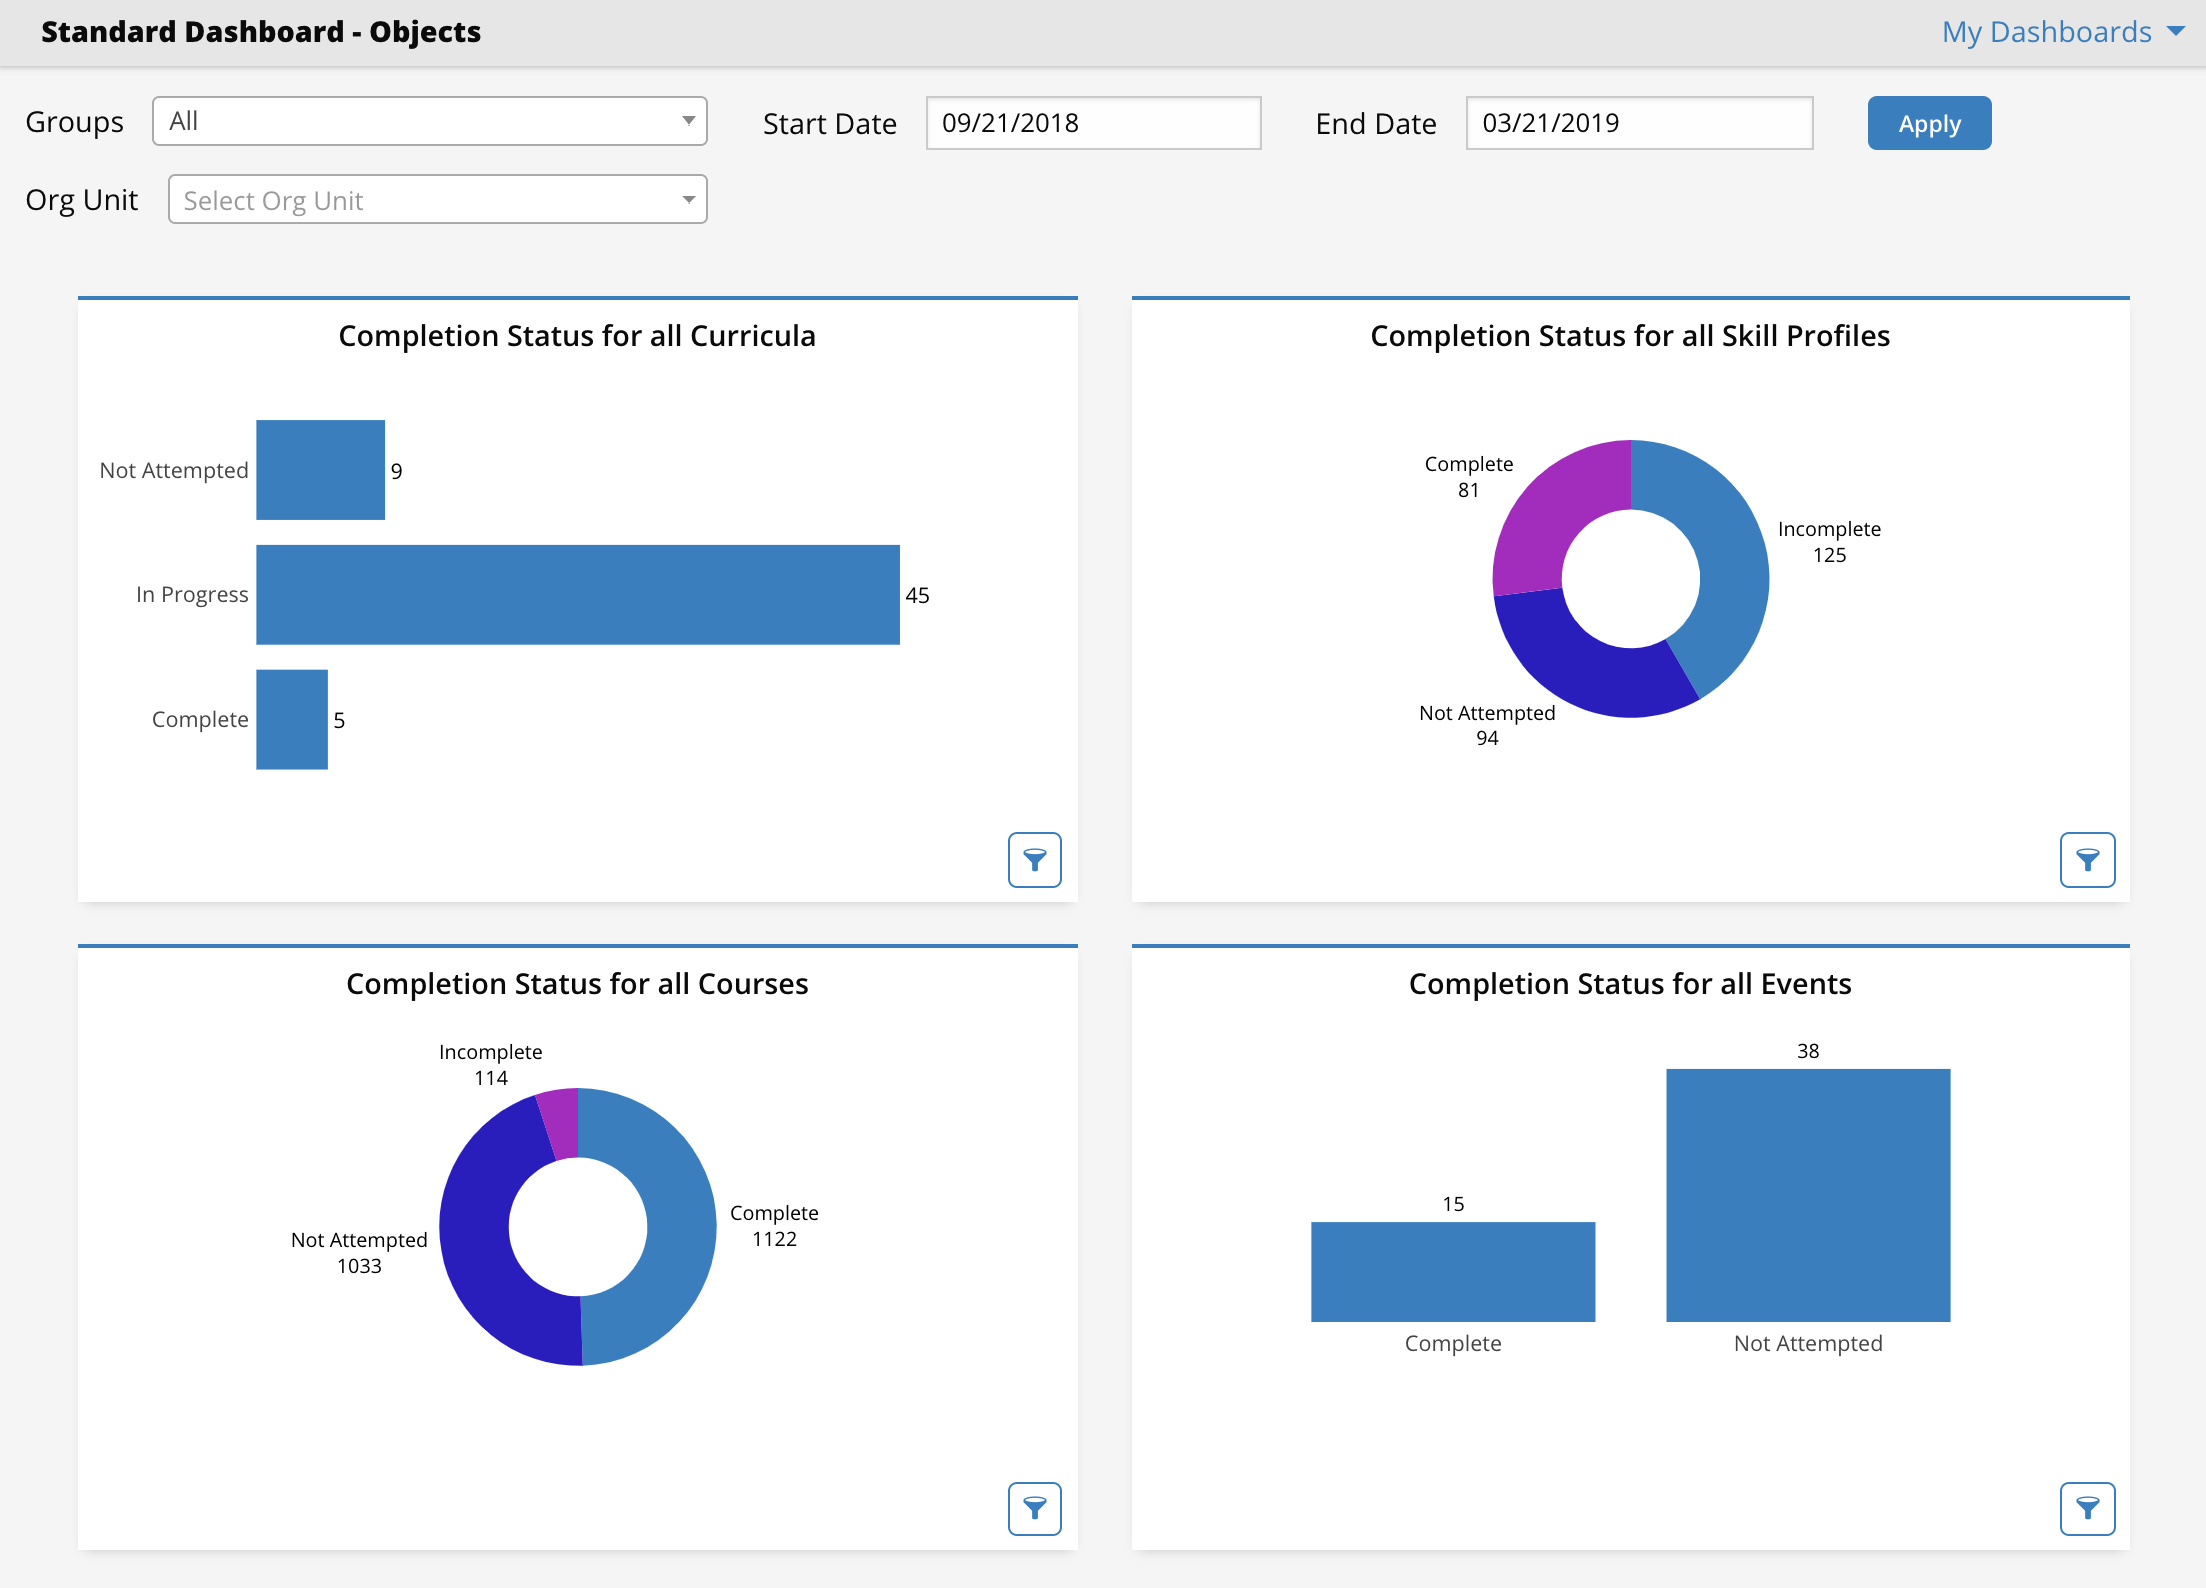
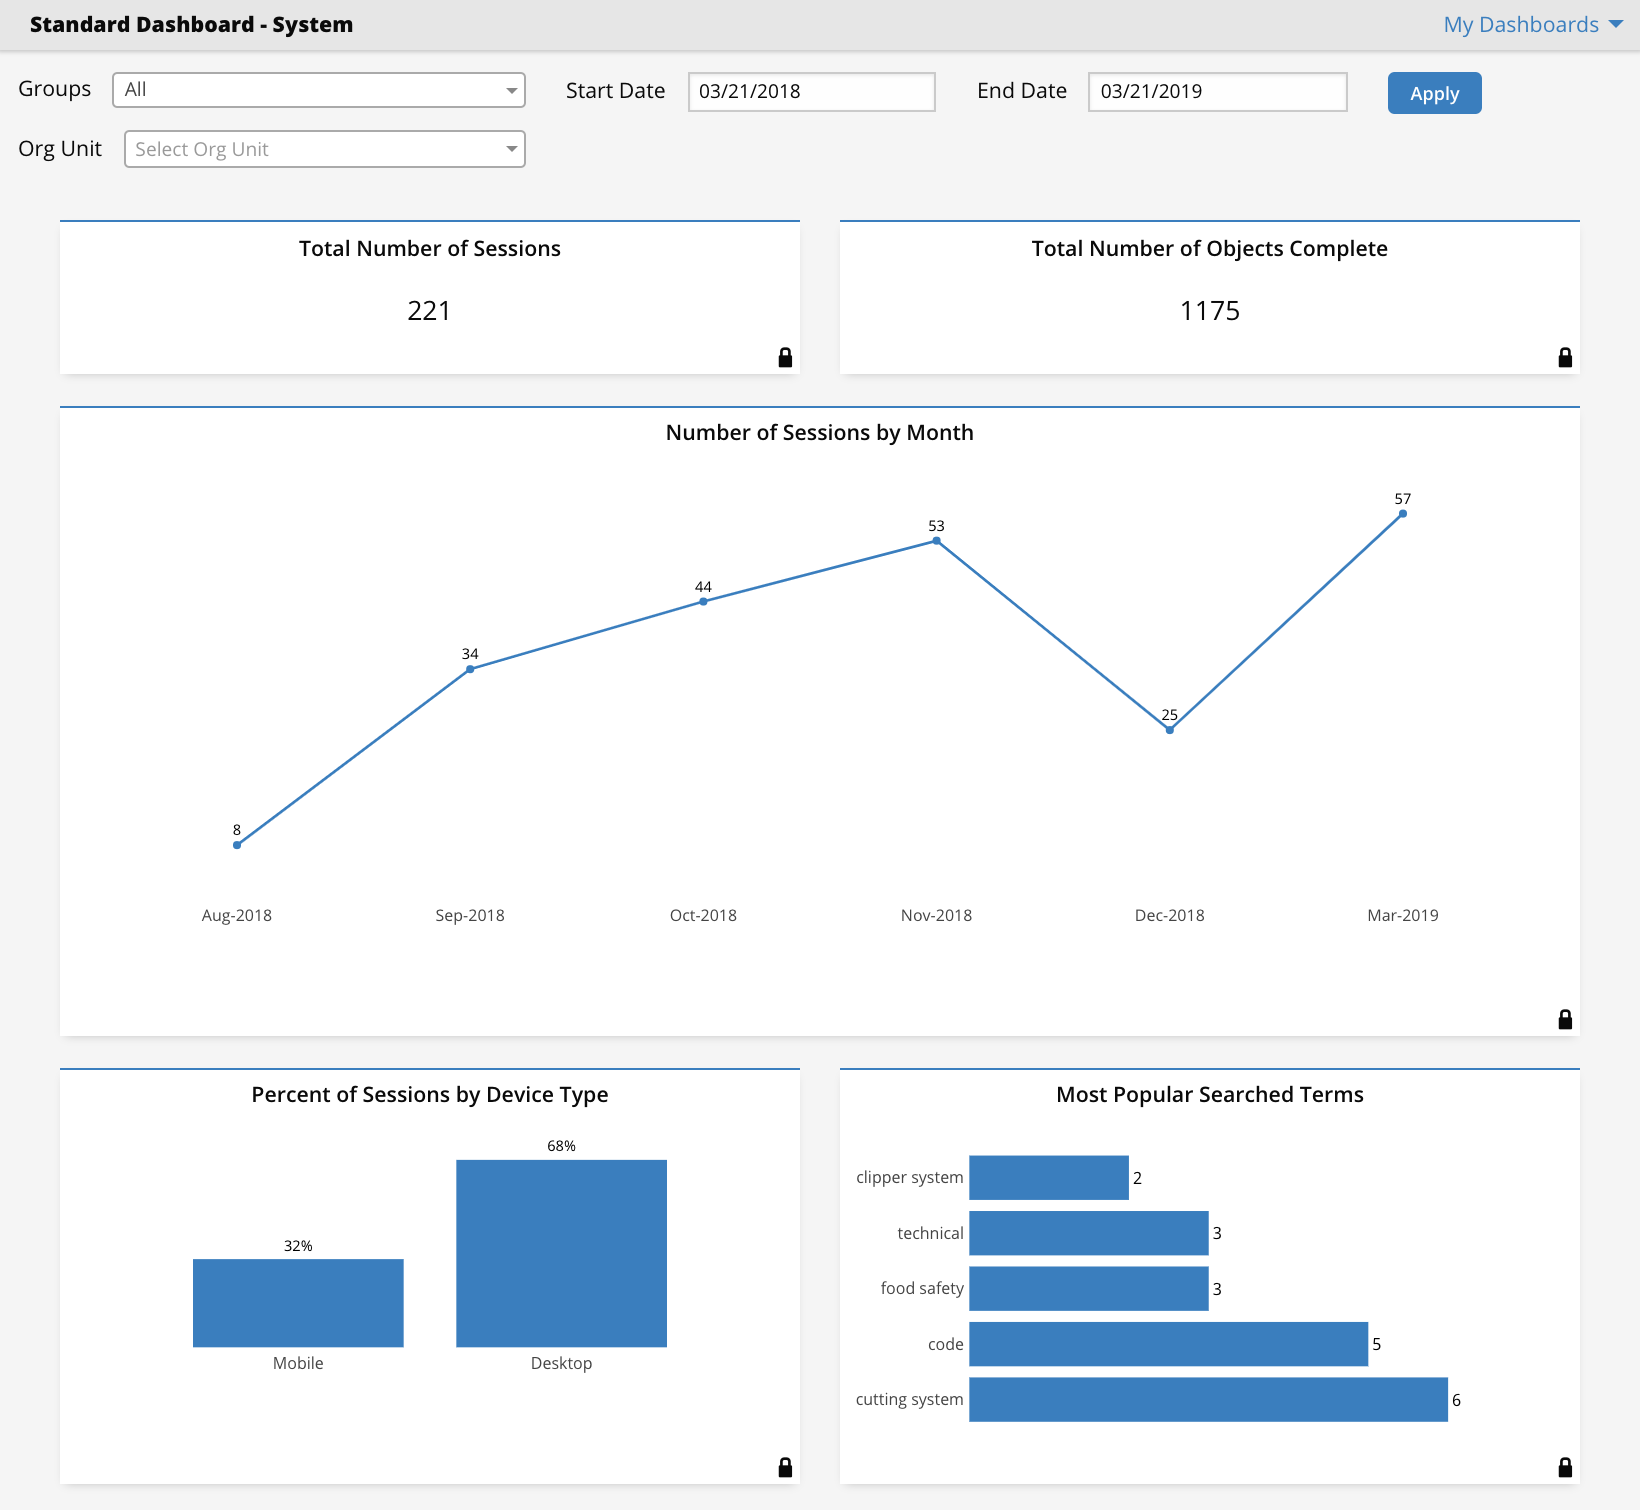
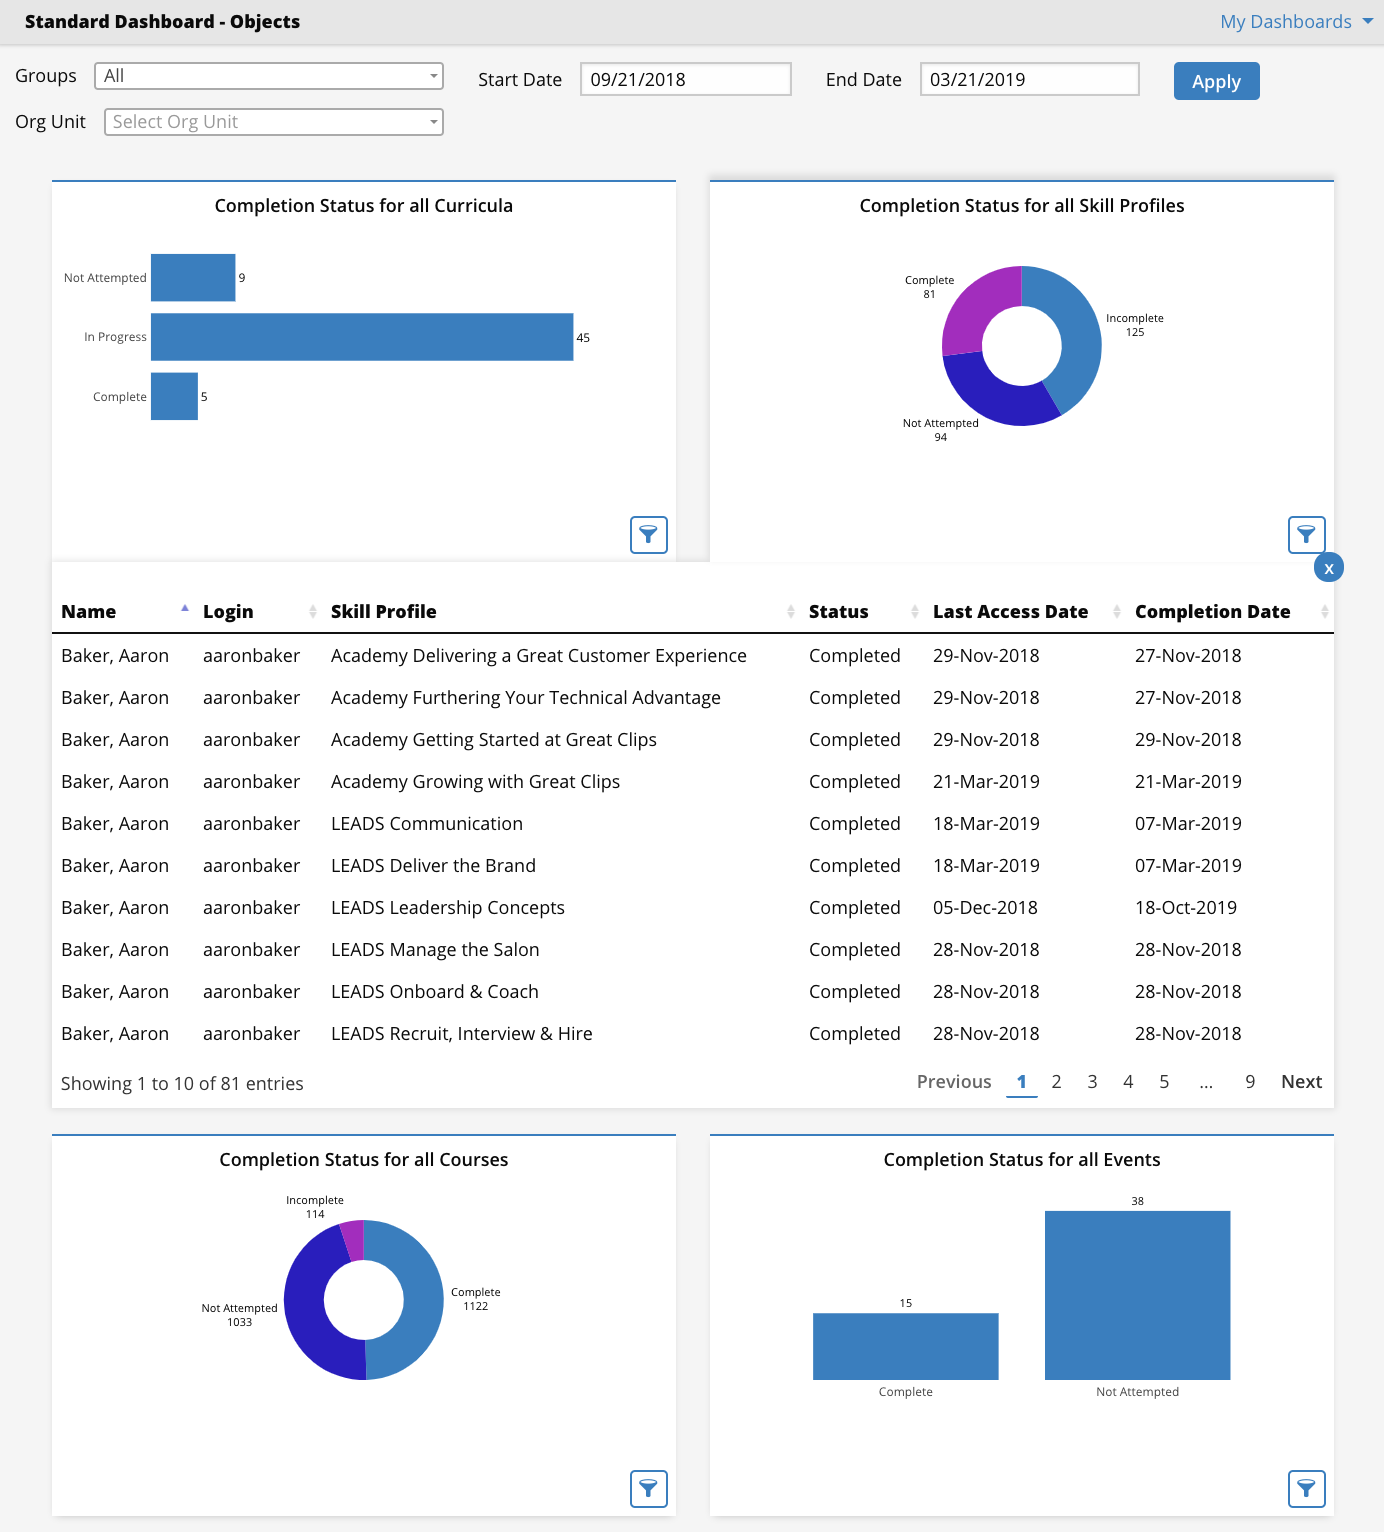
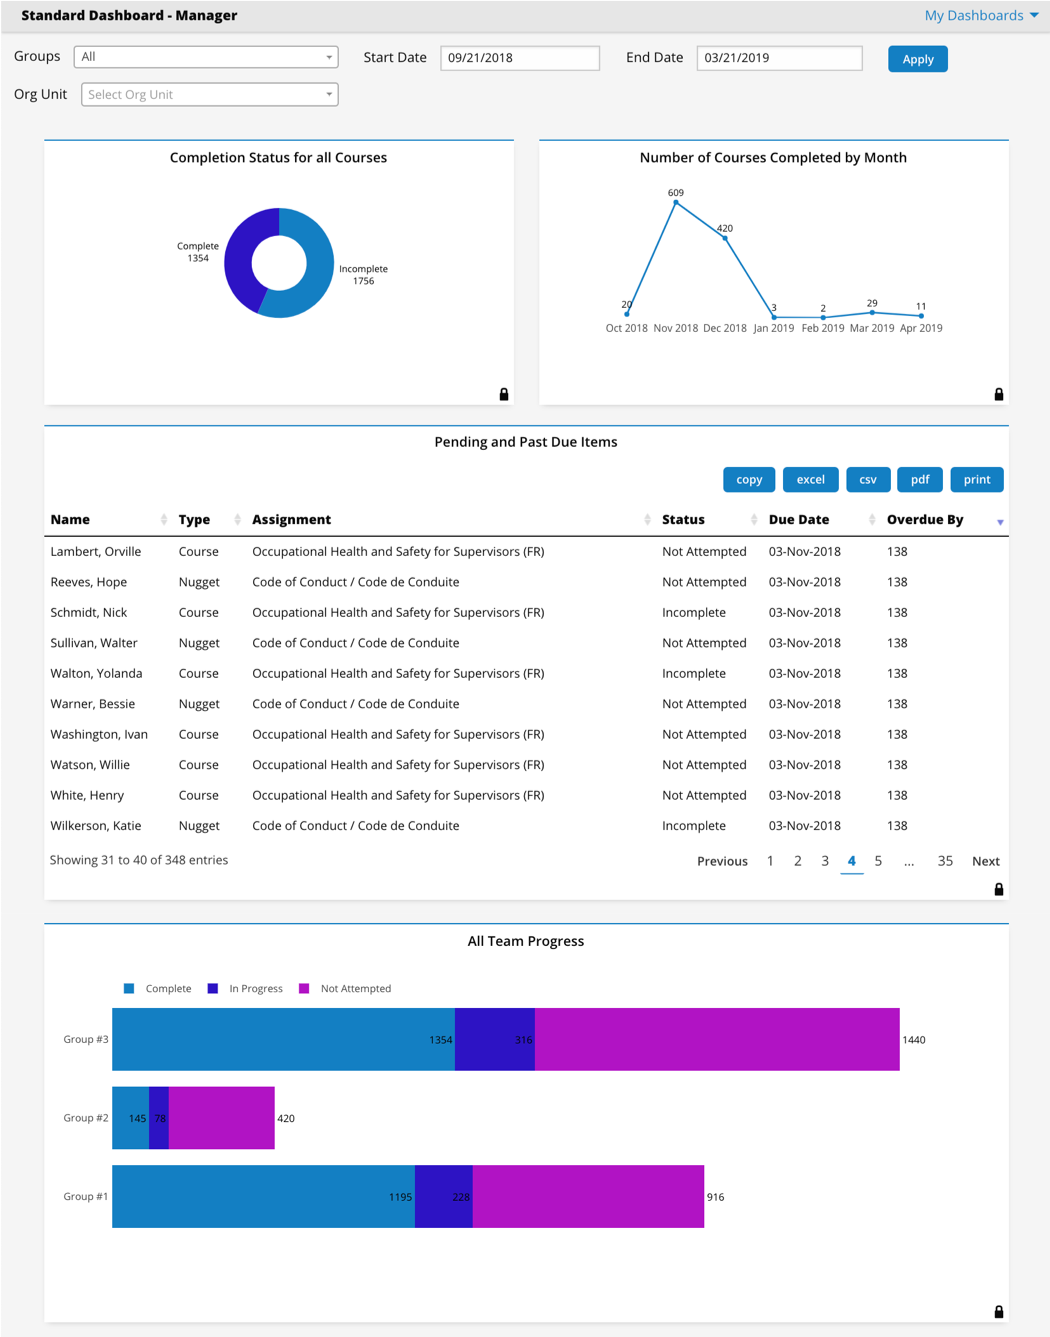
OnPoint’s Analytics Engine provides rapid and visually rich insights into key learning and performance data that facilitate real-time decision making and course-correcting. Customized dashboards crafted to meet any business need can be created by leveraging a growing library of widgets that surface a wide range of data, from learner progress and achievement, to system access and use, including search behaviors. Each widget can be configured and filtered to pinpoint the most important data, calculate the key statistic for that data, and then communicate that data effectively by selecting from a broad set of visualization types. Through highly configurable group-based permissions, these dashboards deliver situation-specific results to administrators, managers, and supervisors, ensuring they can get to the data they need---and only the data they need---at the click of a mouse, or the tap of a finger.
Analytics Dashboards, by the Numbers:
- 23 Widgets
- 9 Visualization Types
- 3 Statistics